Light-Duty Vehicle GHG Emissions: A Transparent, Dynamic Model
Author and Model Designer: Jim Crump
Model Support: Shaikh Aamir
Programmer: Preston Satterfield
UH Energy Faculty Sponsor: Ramanan Krishnamoorti
UH Energy has developed of a model comparing lifetime GHG emissions of ICEVs (internal combustion vehicles) and EVs (electric vehicles) for passenger cars and pickup trucks. The model is transparent (assumptions are clearly disclosed) and dynamic (reference values may be adjusted to test new scenarios), enhancing model value for vehicle GHG evaluation.
The threat of global warming resulting from greenhouse gas
emissions commands our attention. The transportation sector as a
whole comprises approximately 29% of all greenhouse gas (GHG)
emissions in the U.S. Light-duty vehicles – passenger cars, SUVs,
minivans, pickup trucks - account for a substantial share of
transportation sector GHG emissions, approximately 18% of total U.S.
GHG emissions.
Government policies and commercial plans supporting EV
deployment rely on the claim that the substitution of light-duty
EVs (Electric Vehicles) for ICEVs (Internal Combustion Engine
Vehicles) would significantly reduce GHG emissions. Can EVs play
a transformative role in GHG abatement and climate risk mitigation? To address this question, UH Energy at the University of Houston has sponsored development of a model comparing lifetime GHG emissions of ICEVs and EVs for two major light duty vehicle categories, passenger cars and pickup trucks.
This explanatory note and user guide will cover: GHG model
precedents, objectives of the present model, model structure,
model use with operating guidelines, model-based conclusions,
information sources, and model updating.
Earlier studies of vehicular GHG emissions have contributed valuable
information and insights. The National Argonne Laboratory, a U.S.
Department of Energy Scientific and Engineering Research Center,
created the GREET Model (Greenhouse Gases, Regulated Emissions, and
Energy Use in Transportation) in 1996. The extensive and detailed
structure of the GREET Model provides regularly updated data related
to vehicle emissions.
Several research teams have expanded the evaluation of vehicle
emissions. A report by Arthur D. Little (2016) compared lifetime
GHG emissions of ICEVs and EVs for two light vehicle models, compact
and mid-size passenger cars. The authors concluded that EV emissions
were lower based on a comparison of vehicles that were available in
the 2015 model year.
More recent work by Reuters (June, 2021) utilized the GREET Model
to assess the time-scale for an EV to match the GHG emission of an
ICEV of the same vehicle class. The Reuters study recognized that
GHG emissions during manufacturing are greater for an EV than for a
ICEV due to emissions associated with lithium-ion battery sourcing
and assembly. Given that GHG emissions are lower during operation
for EVs compared to ICEVs, the Reuters study determined that an EV
passenger car will reach GHG emission parity, or “breakeven”, with
an ICEV during the second year of operation, thereafter generating
lower yearly and lifetime emissions.
Further work by the International Council on Clean Transportation
(ICCT) examined light vehicle emissions for recent models in the
U.S. as well as other transportation markets including Europe, China,
and India (July, 2021). The comparison of ICEV and EV emissions
across different study regions led the authors to emphasize the
importance of the de-carbonization of the generation infrastructure
supplying electricity for EV operation.
These prior models have added progressively to our understanding
of GHG emissions of ICEVs compared to those of EVs. The studies
cited above clarified several directional effects, notably the
comparatively higher GHG impact of the manufacturing stage for
EVs, the lower level of EV emissions compared to ICEV emissions
during operation, and the importance of electric grid
de-carbonization for abatement of emissions associated with EVs.
The new model presented here incorporates important,
distinctive features that enhance model value. The model is
(1) fully transparent and (2) usefully dynamic:
Model transparency: The model’s fully accessible structure and
clear presentation of GHG values provide to the model user a direct
view of all model components, including reference values and information
sources.
Dynamic features: The model permits meaningful user interaction
through adjustment of key parameters. The user can test scenarios
that require variation of the model’s reference values.
These novel features reinforce the value of the model for vehicle
GHG evaluation and for support of informed public discourse concerning
EV deployment.
The model is designed to support the purchase decisions of vehicle
buyers in today’s market. For passenger cars a specific EV model,
the Tesla Model 3, is compared to an ICEV passenger car (representative
ICEV models include the Chevrolet Malibu, Volkswagen Jetta, Honda Accord,
Nissan Altima). For pickup trucks, a specific EV model, the Ford Lightening
Electric 150, is compared to an ICEV pickup truck (representative ICEV models
include the Chevrolet Silverado, GMC Sierra, Ford F150, Toyota Tundra, Nissan
Titan).
The model structure is based on a cradle-to-grave life-cycle analysis (LCA) comparing light-duty ICEV and EV emissions for passenger cars and pickup trucks. The cradle-to-grave LCA methodology has been widely described. Its purpose is to provide a complete accounting of GHG emission sources and quantities for the objects under study. In the present study, the method is adapted to compare GHG emissions associated with ICEVs with those of EVs. The LCA structure appears in Figure 1.
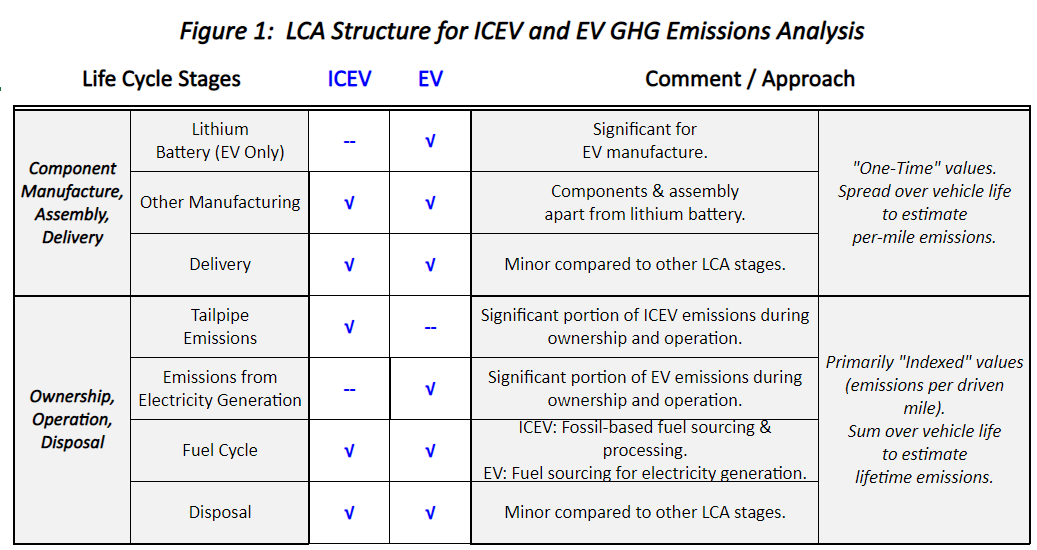
This life-cycle model follows ICEVs and EVs through the well-recognized stages presented in Figure 1.
The first stage covers Manufacture and Assembly, including material sourcing, as well as delivery
to retail sales centers.
The later stage covers Ownership, Operation, and Disposal. For the ICEV case this stage includes
tailpipe emissions, the fuel cycle (oil production, gasoline refining, and gasoline transport to sales),
and vehicle disposal. For the EV case this stage includes emissions from electricity generation for each
generation source, the fuel cycle (for fossil-based electricity generation, the production and transport of
fuel to generation sites), and again disposal.
Assessment of emissions from electricity generation takes account of the impact of factors that
affect electricity demand for EV operation. In addition to EV energy efficiency during operation
(referenced here as 3.7 miles per KWh for the Tesla 3 passenger car, 2.1 miles per KWh for the Ford
Lightening Electric pickup truck), model calculations of the energy requirement for EV operation also
include:
- Line losses in electricity transmission and distribution (referenced as 4.9%)
- Energy loss on battery charging (13% for each charging event)
- Battery self-discharge, or “leakage” (6% per year of average charge over the vehicle lifetime).
Two web pages present model inputs along with GHG graphical results.
The first web page presents input tables (along with graphs of GHG
emissions, MT per year) for the CAR category: the EV Tesla 3, along
with ICEV comparative models as noted above. The second web page
presents input tables (along with graphs of GHG emissions, MT per year)
for the PICKUP TRUCK category: EV Ford Lightening Electric 150, along
with comparative ICEV models as noted above.
Input sequencing is the same for ICEV-CAR and ICEV-PICKUP TRUCK and
the same as well for EV-CAR and EV-PICKUP TRUCK. Of course,
ICEV-related input values differ between CAR and PICKUP TRUCK for
specific inputs, including the values for vehicle life (years),
manufacturing and delivery (MT CO2e), fuel efficiency
(miles per gallon), and tank truck transport to sales centers
(MT CO2e per year).
Similarly, EV-related input values also differ between CAR and
PICKUP TRUCK for specific inputs, including the values for vehicle
life (years), manufacturing and delivery (MT CO2e), energy efficiency
(miles per KWh), and battery charge level (KWh).
User Notes – ICEV Input Changes
- The user may adjust the ICEV input values to test user-defined scenarios.
- Of course, in some cases (for example a degradation, or reduction, in fuel efficiency in units of miles per gallon), the graphical representation may be “over-ranged”.
User Notes – EV Input Changes
- Again, the user may adjust the EV input values to test user-defined scenarios
- Similar comments apply with respect to “over-ranging” of the GHG graphs (for example, lowering of energy efficiency in miles per KWh consumed may lead to “over-ranging”).
- Two further note of caution apply to EV input adjustments. First, the adjustment of transmission line loss (transmission and distribution to user electric supply) is limited to a maximum of 20% (compared to a reference value of 4.9%). Increasing this value without limit of course increases electricity demand and associated GHG emissions; a value of 100% causes the model to fail due to infinite electricity demand.
- Second, calling attention to the electricity generation sources (natural gas, coal, petroleum, nuclear, renewables), reference values correspond to the U.S. national average and the user may apply alternate generation sourcing on a state-by-state basis. The user may also adjust all individual sources. Of course, a reasonable generation profile must lead to a total of 100%; a cautionary note alerts the reader if the proposed generation sum is above or below 100%.
For both vehicle categories, CAR and PICKUP TRUCK,
substitution of the EV model for an ICEV would reduce
GHG emissions by more than 50% based on this model
version. However, this conclusion does not support
simple “electrification’ of light vehicles because
significant GHG reduction is achieved only if the new
vehicle is an EV-CAR . If for example a vehicle owner
replaces an ICEV-CAR with an EV-PICKUP TRUCK, a GHG
reduction of only about 25% would result. Of course,
the reverse change in category would lead to substantial
GHG reduction. If a vehicle owner replaces an ICEV-TRUCK
with an EV-CAR, GHG reduction of 60-70% would result.
Model features permit the exploration of user-defined scenarios.
Scenarios that might interest users and that would adjust GHG
levels significantly might include:
- Improvement in ICEV fuel efficiency (miles per gallon), from reference values of 30.9 (CAR) and 16.7 (PICKUP TRUCK). Tailpipe GHG emissions fall with increased fuel efficiency. Total ICEV-CAR emissions reach equivalence with EV-CAR at a fuel efficiency of about 75 miles per gallon; total ICEV-TRUCK GHG emissions reach approximate equivalence at a fuel efficiency of about 45 miles per gallon.
- Reduction of emissions associated with the ICEV fuel cycle (fuel supply chain). Pubic debate has focused on tailpipe emissions for ICEVs. However, apparent fuel cycle emissions account for about 25% of total yearly GHGs for both CAR and PICKUP TRUCK. Thus an appreciable reduction in emissions could be achieved through remediation of ICEV fuel cycle emissions. The fuel cycles accounts for a lower proportion of EV total emissions (less than 10%) for both categories, offering slight opportunity in comparison with ICEV fuel cycles.
- De-Carbonization of the Electric Grid. For average U.S. generation, “non-emission” sources (nuclear plus renewables) account for about 40% of total generation. In California, the most populous state, “non-emission” sources account for about 52% of generation. An increase in non-emission sources from the U.S. average to the California basis would reduce EV emissions by more than 25% for both vehicle categories.
- Reduction in vehicle lifetime. The fixed (one-time) emissions associated with EV manufacture (including lithium battery) plus delivery exceed 20% of average yearly emissions for CAR and PICKUP TRUCK; the equivalent emission level is less than 8% of average yearly emissions for ICEVs. Thus, if vehicle lifetime is reduced holding other factors constant, the resulting yearly increase in manufacturing-related emissions for EVs leads to total emissions that exceed emissions for ICEVs at very low lifetime values. Based on this model version, the “breakeven” or “crossover” point (for which cumulative EV and ICEV emissions are equal) occurs at a vehicle lifetime that is less that two years for both CAR and PICKUP TRUCK. Below this breakeven time, cumulative EV-based emissions are higher than cumulative ICEV-based emissions; above this breakeven time, cumulative EV-based emissions are lower than cumulative ICEV-based emissions. (This result is consistent with the findings of the Reuters study referenced above concerning breakeven emissions timing.)
Information sources utilized at each life-cycle stage are presented below in Table 1 for each vehicle type, ICEV and EV. Information required for vehicle manufacturing, fuel or energy efficiency, and fuel supply and processing are sourced primarily for the years 2020-2021, from documents published by organizations of the U.S. federal government.
The widely-referenced GREET Model managed by the National Argonne Laboratory (U.S. Department of Energy) serves as an important source. References associated with operation (for example, lifetime miles traveled for each vehicle category) and the fuel cycle for electricity generation (fuel production and supply to generation sites) are provided by GREET 1. References associated with manufacturing are provided by GREET 2. Each GREET reference notes the program used (GREET 1 or GREET 2), spreadsheet name, and spreadsheet section to facilitate source review.
Publications by these government organizations also provide important model references:
Environmental Protection Agency (EPA)
Energy Information Agency (EIA), of the Department of Energy (DOE)
Office of Scientific and Technical Information, of the U.S. Department of Energy
Office of Energy Efficiency and Renewable Energy, of the U.S. Department of Energy
Alternative Fuels Data Center, of the U.S. Department of Energy
US Department of Transportation (DOT)
Planned updates of input values are necessary to ensure “evergreen” model capability. This process will align model results with advances in automotive technology and commercial deployment. Most of the model references are provided by the U.S. federal agencies noted above. The Argonne National Laboratory, the U.S. EIA, EPA, and other government organizations routinely update published information on a yearly basis, enabling regular refresh of these input values.
Information provided by private sector organizations will require special
attention in the model update process. References for these inputs are
noted in Table 1 and include:
- Carbon Intensity of Crude Oil Production
- Carbon Intensity of Crude Oil Refining
- Global Warming Potential (GWP) of Indirect Greenhouse Gases Relative to Carbon Dioxide (here, with reference to ethanol)
- Greenhouse Gas Emissions Associated with Vehicle Disposal.
Navigate to the ICEV Car vs Tesla 3 page to test model input changes.
Navigate to the ICEV Pickup vs F150 Elec page to test model input changes.
Information Sources
Average Annual Vehicle Miles Traveled by Major Vehicle Category (U.S. AFDC - Alternative Fuels Data Center, Dept. of Energy), https://afdc.energy.gov/data/10309
Vehicle Lifetime Miles - GREET2-2020 (Argonne National Laboratory), Car (Section 6) and PUT, Pickup Truck (Section 6)
Manufacturing
GREET2-2020 (Argonne National Laboratory), Vehi_Comp_Sum (Section 3.1) and Vehi_Sum, (Section 1.1)
Delivery
Authors' Estimate
Tailpipe Emissions
Fuel Efficiency (gasoline miles per gallon) – GREET1-2020 (Argonne National Laboratory), Car_TS, (Section 1); EPA Fuel Economy Guide, (U.S. EPA, 2020), https://www.fueleconomy.gov/feg/pdfs/guides/FEG2021.pdf
CO2e per Gallon Consumed - Environmental Effects of Battery Electric and Internal Combustion Engine Vehicles (U.S. Congressional Research Service, 2020), https://fas.org/sgp/crs/misc/R46420.pdf; Greenhouse Gas Equivalencies, Calculations and References (U.S. EPA, 2020), https://www.epa.gov/energy/greenhouse-gases-equivalencies-calculator-calculations-and-references
Fuel Cycle
Fuel Content of Ethanol, (U.S. EIA, 2020), https://www.eia.gov/tools/faqs/faq.php?id=27&t=10
Refining Volumetric Gain – Oil and Petroleum Products (U.S. EIA, 2020), https://www.eia.gov/energyexplained/oil-and-petroleum-products/refining-crude-oil-inputs-and-outputs.php
Global Carbon Intensity of Crude Oil Production (Science 361, 2018), https://www.researchgate.net/publication/327328315_Global_carbon_intensity_of_crude_oil_production
Carbon Intensity of Global Crude Oil Refining, (Nature Climate Change, 2020), https://www.nature.com/articles/s41558-020-0775-3
Reducing Gasoline Loss from Evaporation by the Introduction of a Surface-Active Fuel Additive (Urban Transport, 2020), https://www.researchgate.net/publication/289983807_Reducing_gasoline_loss_from_evaporation_by_the_introduction_of_a_surface-active_fuel_additive
The Global Warming Potential of Indirect Greenhouse Gases Relative to Carbon Dioxide (IPCC, 2020), https://www.genano.com/infobase/greenhouse-gases-and-their-harmful-effects
Tank Truck Transport to Fuel Sales Centers – Authors’ Estimate
Ethanol Fuel Cycle Emissions - GREET1-2020 (Argonne National Laboratory), EtOH, (Section 4.1)
Disposal
Battery Electric Vehicles vs. Internal Combustion Engine Vehicles (A.D. Little, 2016), https://www.adlittle.com/sites/default/files/viewpoints/ADL_BEVs_vs_ICEVs_FINAL_November_292016.pdf
Manufacturing
GREET2-2020 (Argonne National Laboratory), Vehi_Comp_Sum (Section 3.1) and Vehi_Sum, (Section 1.1)
Delivery
Authors' Estimate
Tailpipe Emissions
Fuel Efficiency (gasoline miles per gallon) – GREET1-2020 (Argonne National Laboratory), LDT2_TS, (Section 1); EPA Fuel Economy Guide (U.S. EPA, 2020), https://www.fueleconomy.gov/feg/pdfs/guides/FEG2021.pdf
CO2e per Gallon Consumed - Environmental Effects of Battery Electric and Internal Combustion Engine Vehicles (U.S. Congressional Research Service, 2020), https://fas.org/sgp/crs/misc/R46420.pdf; Greenhouse Gas Equivalencies, Calculations and References (U.S. EPA, 2020), https://www.epa.gov/energy/greenhouse-gases-equivalencies-calculator-calculations-and-references
Fuel Cycle
Fuel Content of Ethanol, (U.S. EIA, 2020), https://www.eia.gov/tools/faqs/faq.php?id=27&t=10
Refining Volumetric Gain – Oil and Petroleum Products (U.S. EIA, 2020), https://www.eia.gov/energyexplained/oil-and-petroleum-products/refining-crude-oil-inputs-and-outputs.php
Global Carbon Intensity of Crude Oil Production (Science 361, 2018), https://www.researchgate.net/publication/327328315_Global_carbon_intensity_of_crude_oil_production
Carbon Intensity of Global Crude Oil Refining, (Nature Climate Change, 2020), https://www.nature.com/articles/s41558-020-0775-3
Reducing Gasoline Loss from Evaporation by the Introduction of a Surface-Active Fuel Additive (Urban Transport, 2020), https://www.researchgate.net/publication/289983807_Reducing_gasoline_loss_from_evaporation_by_the_introduction_of_a_surface-active_fuel_additive
The Global Warming Potential of Indirect Greenhouse Gases Relative to Carbon Dioxide (IPCC, 2020), https://www.genano.com/infobase/greenhouse-gases-and-their-harmful-effects
Tank Truck Transport to Fuel Sales Centers – Authors’ Estimate
Ethanol Fuel Cycle Emissions - GREET1-2020 (Argonne National Laboratory), EtOH, (Section 4.1)
Disposal
Battery Electric Vehicles vs. Internal Combustion Engine Vehicles (A.D. Little, 2016), https://www.adlittle.com/sites/default/files/viewpoints/ADL_BEVs_vs_ICEVs_FINAL_November_292016.pdf
Lithium Battery
GREET2-2020 (Argonne National Laboratory), Vehi_Comp_Sum, (Section 3.1) and Vehi_Sum, (Section 1.1)
Manufacturing
GREET2-2020 (Argonne National Laboratory), Vehi_Comp_Sum (Section 3.1) and Vehi_Sum, (Section 1.1)
Delivery
Authors' Estimate
Emissions from Electricity Generation
Energy Efficiency (miles per KWh charged), Tesla 3 Mid-Range, https://www.fueleconomy.gov/feg/Find.do?action=sbs&id=42474
Charge Loss, per Charge Event, % of full charge, EPA Certificate of Conformity, https://iaspub.epa.gov/otaqpub/display_file.jsp?docid=51235&flag=1
Self-Discharge Rate, EPA Certificate of Conformity
Battery Full Charge, KWh, EPA Certificate of Conformity
Line Loss – Transmission, Distribution, GREET1-2020 (Argonne National Laboratory), Electric, (Section 12)
Electricity Sources, % Generation – U.S. Average, (U.S. EIA, 2020), https://www.eia.gov/tools/faqs/faq.php?id=427&t=3, CO2e (MT/MWh) values for major fossil sources are calculated from emissions of CO2 plus emissions of non-CO2 GHG gases and GWP values.
Electricity Sources, % Generation – State by State, (Nuclear Energy Institute, 2020), https://www.nei.org/resources/statistics/state-electricity-generation-fuel-shares
CO2e for Other Generation Sources (Nuclear and All Renewables), (UN IPCC,2021), https://www.world-nuclear.org/information-library/energy-and-the-environment/carbon-dioxide-emissions-from-electricity.aspx
Carbon Dioxide Produced per Kilowatt-hour of U.S. Electricity Generation, (U.S. EIA 2019) – Natural Gas, Coal, Petroleum, https://www.eia.gov/tools/faqs/faq.php?id=74&t=11
CO2e factors (methane, nitrous oxide) for fossil sources (Natural Gas, Coal, Petroleum), GREET1-2020 (Argonne National Laboratory), Electric, (Section 4)
CO2 intensity – GWP 100 (methane, nitrous oxide), Inventory of U.S. Greenhouse Gas Emissions and Sinks, (U.S. EPA, 2020), https://www.epa.gov/sites/default/files/2020-04/documents/us-ghg-inventory-2020-chapter-executive-summary.pdf
Fuel Cycle - Fossil Sources
Natural Gas – Emissions per MMbtu of Natural Gas Supplied, GREET1-2020 (Argonne National Laboratory), NG, (Section 4.1)
Natural Gas - Quantity of Natural Gas Used To Generate a KWh of Electricity, (U.S. EIA 2021), https://www.eia.gov/tools/faqs/faq.php?id=667&t=2
Coal – Emissions per MMbtu of Coal Supplied, GREET1-2020 (Argonne National Laboratory, Coal, (Section 3)
Coal – Quantity of Coal Used to Generate a KWh of Electricity, (U.S. EIA 2021), https://www.eia.gov/tools/faqs/faq.php?id=667&t=2
Petroleum – Emissions per MMbtu of Fuel Oil Supplied, GREET1-2020 (Argonne National Laboratory), Petroleum, (Section 5.1)
Petroleum – Quantity of Fuel Oil Used to Generate a KWh of Electricity, U.S. EIA (2021), https://www.eia.gov/tools/faqs/faq.php?id=667&t=2
Disposal
Battery Electric Vehicles vs. Internal Combustion Engine Vehicles (A.D. Little, 2016), https://www.adlittle.com/sites/default/files/viewpoints/ADL_BEVs_vs_ICEVs_FINAL_November_292016.pdf
Lithium Battery
GREET2-2020 (Argonne National Laboratory), Vehi_Comp_Sum, (Section 3.1) and Vehi_Sum, (Section 1.1)
Manufacturing
GREET2-2020 (Argonne National Laboratory), Vehi_Comp_Sum (Section 3.1) and Vehi_Sum, (Section 1.1)
Delivery
Authors' Estimate
Emissions from Electricity Generation
Energy Efficiency (miles per KWh charged), Ford Lightening F150, (GreenCar Reports, 2021), https://www.greencarreports.com/news/1132560_ford-f-150-lightning-85-mpg-gasoline-footprint-cleaner-with-the-grid
Charge Loss, per Charge Event, % of full charge, Assumed equal to charge loss for Tesla 3
Self-Discharge Rate, Assumed equal to the self-discharge rate for Tesla 3
Battery Full Charge, Ford Lightening F150, https://insideevs.com/news/508674/battery-capacity-ford-f150-lightning/
Line Loss – Transmission, Distribution, GREET1-2020 (Argonne National Laboratory), Electric, (Section 12)
Electricity Sources, % Generation – U.S. Average, (U.S. EIA, 2020), https://www.eia.gov/tools/faqs/faq.php?id=427&t=3, CO2e (MT/MWh) values for major fossil sources are calculated from emissions of CO2 plus emissions of non-CO2 GHG gases and GWP values.
Electricity Sources, % Generation – State by State, (Nuclear Energy Institute, 2020), https://www.nei.org/resources/statistics/state-electricity-generation-fuel-shares
CO2e for Other Generation Sources (Nuclear and All Renewables), (UN IPCC,2021), https://www.world-nuclear.org/information-library/energy-and-the-environment/carbon-dioxide-emissions-from-electricity.aspx
Carbon Dioxide Produced per Kilowatt-hour of U.S. Electricity Generation, (U.S. EIA 2019) – Natural Gas, Coal, Petroleum, https://www.eia.gov/tools/faqs/faq.php?id=74&t=11
CO2e factors (methane, nitrous oxide) for fossil sources (Natural Gas, Coal, Petroleum), GREET1-2020 (Argonne National Laboratory), Electric, (Section 4)
CO2 intensity – GWP 100 (methane, nitrous oxide), Inventory of U.S. Greenhouse Gas Emissions and Sinks, (U.S. EPA, 2020), https://www.epa.gov/sites/default/files/2020-04/documents/us-ghg-inventory-2020-chapter-executive-summary.pdf
Fuel Cycle - Fossil Sources
Natural Gas – Emissions per MMbtu of Natural Gas Supplied, GREET1-2020 (Argonne National Laboratory), NG, (Section 4.1)
Natural Gas - Quantity of Natural Gas Used To Generate a KWh of Electricity, (U.S. EIA 2021), https://www.eia.gov/tools/faqs/faq.php?id=667&t=2
Coal – Emissions per MMbtu of Coal Supplied, GREET1-2020 (Argonne National Laboratory, Coal, (Section 3)
Coal – Quantity of Coal Used to Generate a KWh of Electricity, (U.S. EIA 2021), https://www.eia.gov/tools/faqs/faq.php?id=667&t=2
Petroleum – Emissions per MMbtu of Fuel Oil Supplied, GREET1-2020 (Argonne National Laboratory), Petroleum, (Section 5.1)
Petroleum – Quantity of Fuel Oil Used to Generate a KWh of Electricity, U.S. EIA (2021), https://www.eia.gov/tools/faqs/faq.php?id=667&t=2
Disposal
Battery Electric Vehicles vs. Internal Combustion Engine Vehicles (A.D. Little, 2016), https://www.adlittle.com/sites/default/files/viewpoints/ADL_BEVs_vs_ICEVs_FINAL_November_292016.pdf